¶ Log in to Employee Account
You need to make sure you are logged in with your corporate email, and you see this menu:
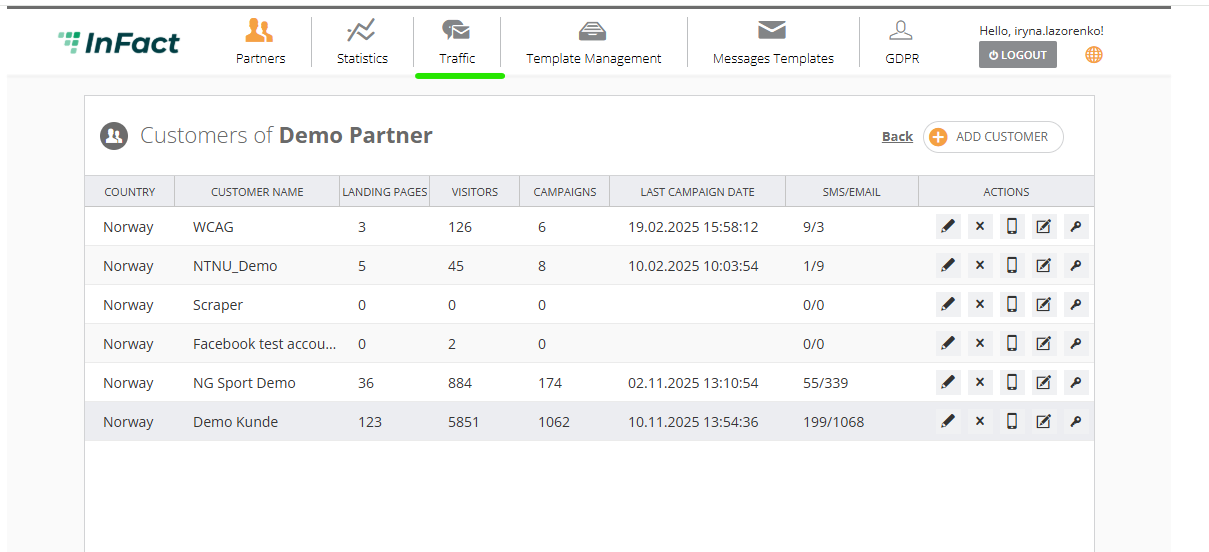
Do not use any SSO users, do not log in into Partner or Customer account in the same browser as you will be logged off as Employee.
¶ Click Traffic
It is highlighted in red in the previous screenshot. You appear on this page. Scroll down and in the left panel, you will see an icon Reports. Click it or use the direct link: https://web.infact.no/reports
It will work only if you are logged in as an Employee.
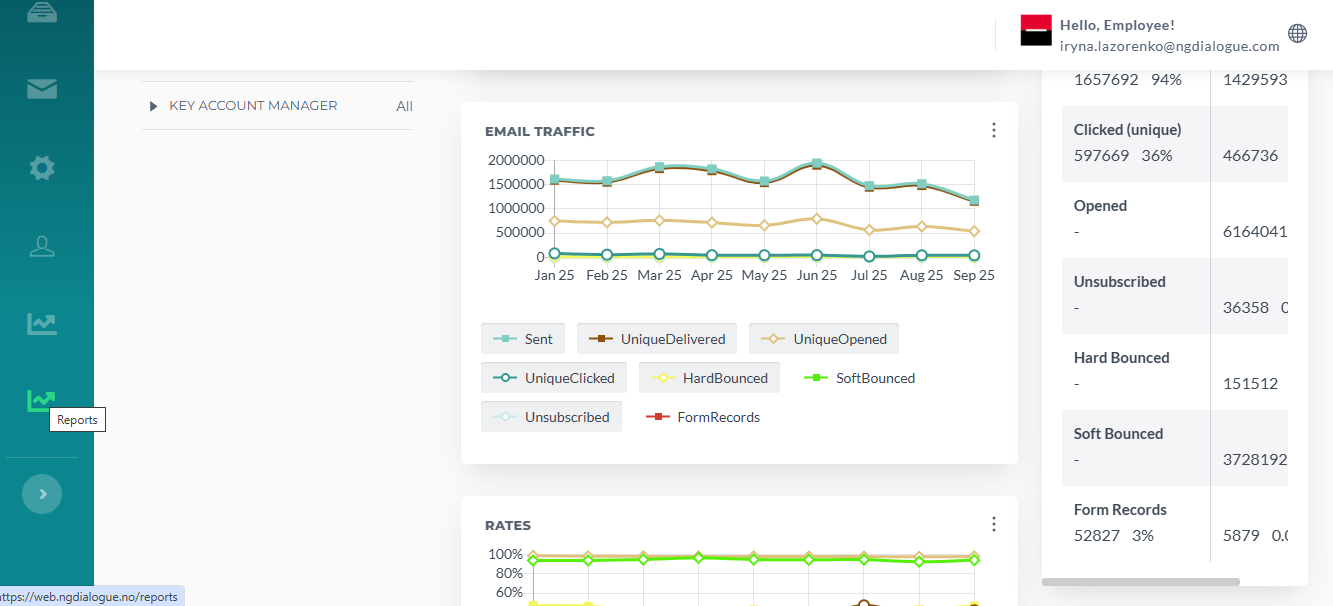
¶ Reports Look
¶ How to Generate Reports
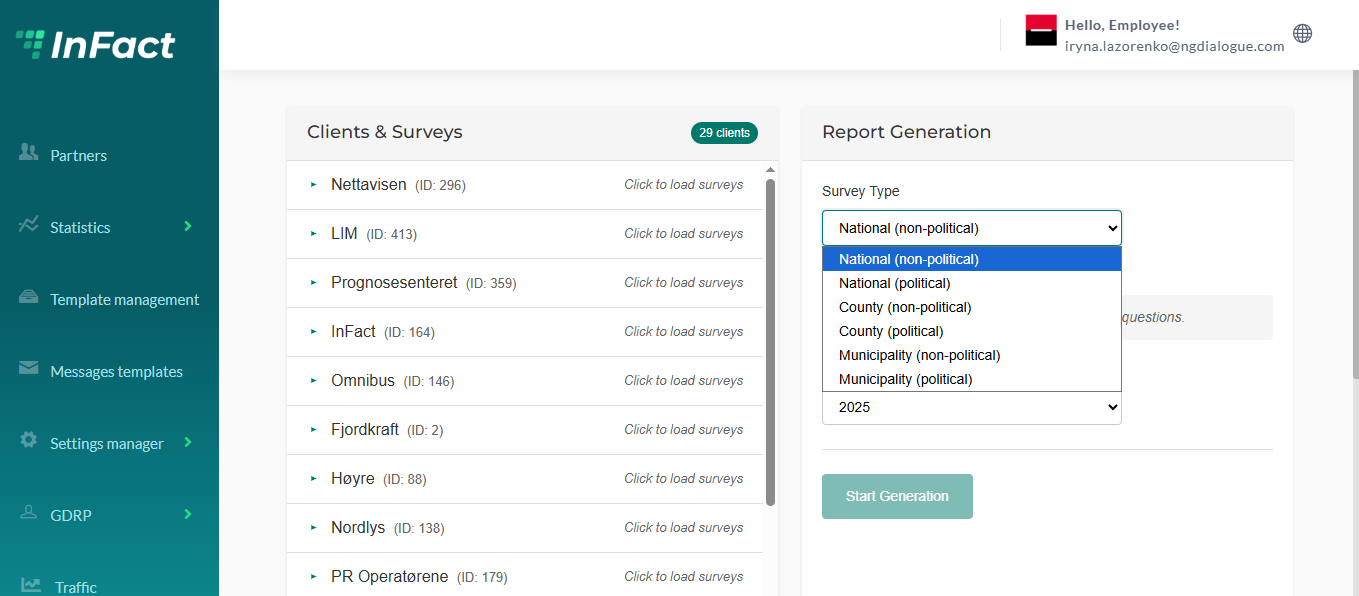
On the left, we have a list of available customers (clients):
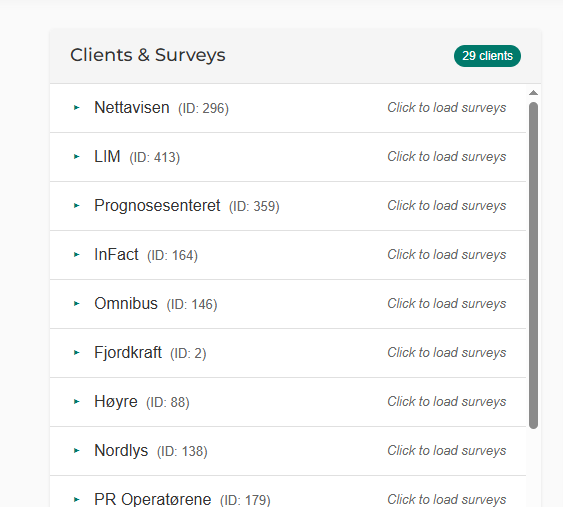
Each customer has a dropdown list with the available surveys that were conducted:
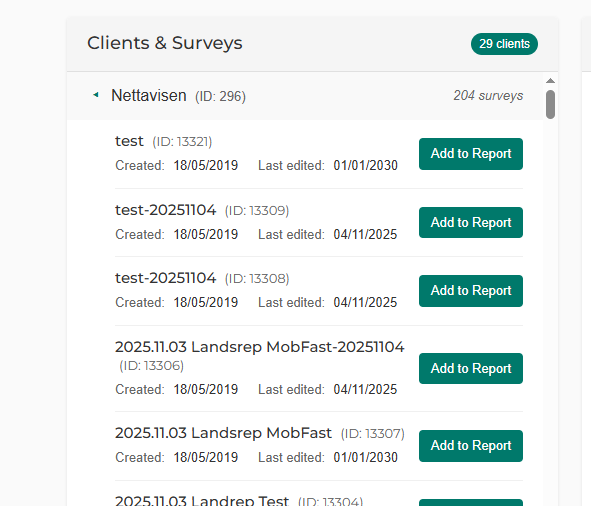
To generate a report, we need to select a survey. Very often, there is more than one survey (e.g., mobile phones, landline phones, etc.).
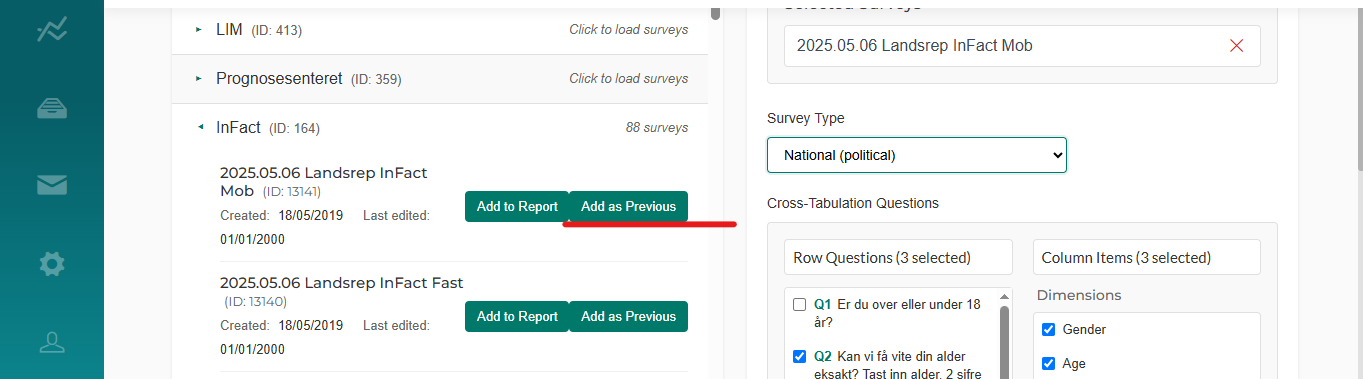
The user must know which survey numbers actually refer to the same overall survey. Then we select the corresponding surveys and click “Add to report”, and on the right side, we see which surveys are included for generation:
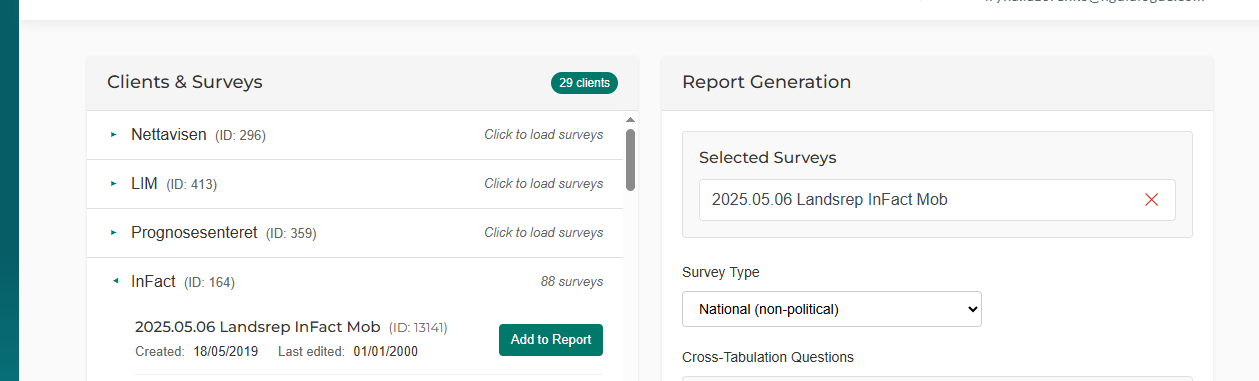
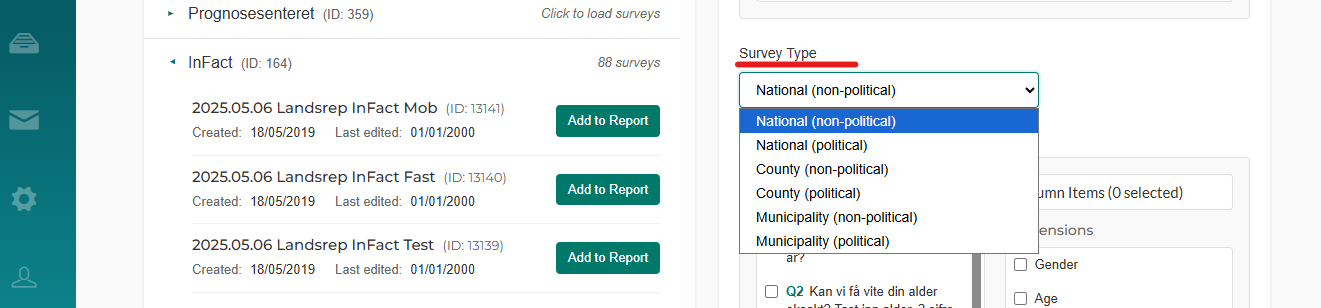
Next, we select the survey type — there are national, regional, and municipal surveys, both political and non-political:
¶ Flow for non-political surveys
¶ National
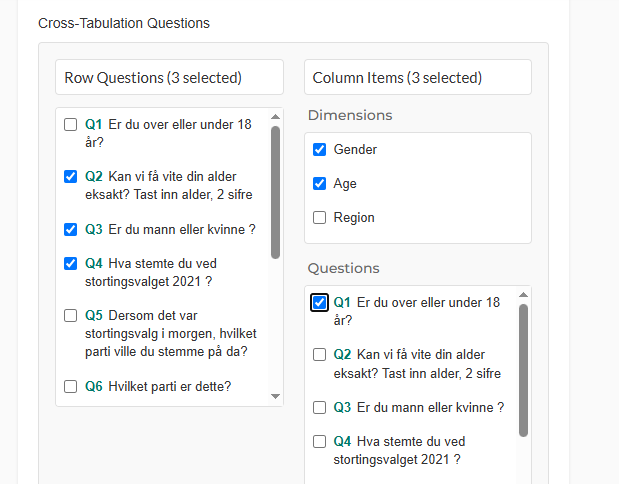
We select, using checkboxes, the questions for rows and the items for columns (dimensions or questions), which will be used to build the cross-tables. Additionally, we can choose gender, region, and age group, and the report will include cross-tables of each selected column question with gender, age group, and region, in addition to the question-to-question tables:
¶ County
A user must select from the dropdown the county for which the survey was conducted:
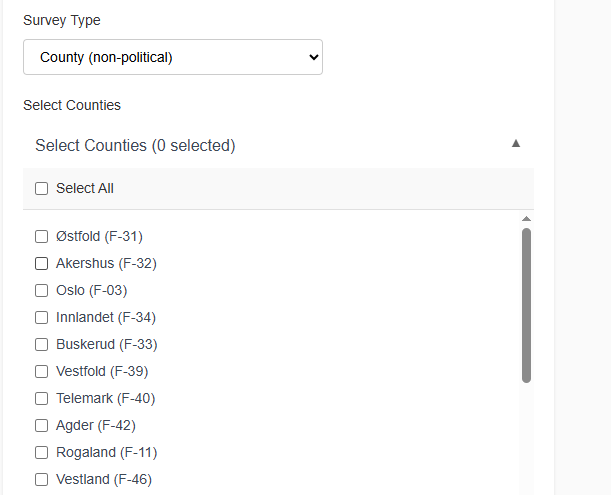
Multiple selections are allowed.
¶ Municipal
Select the corresponding municipality:
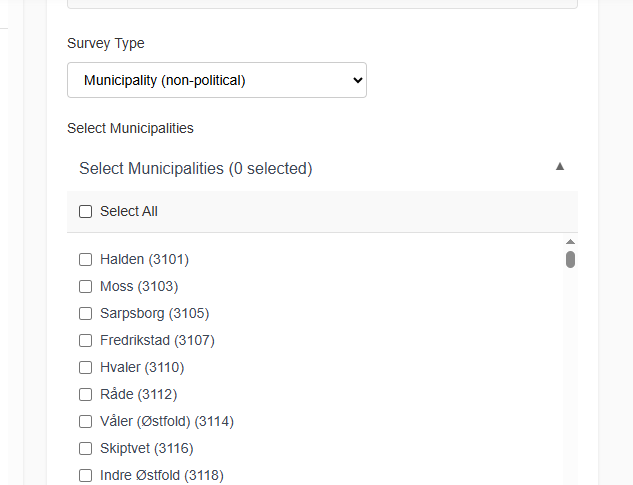
Multiple selections are allowed.
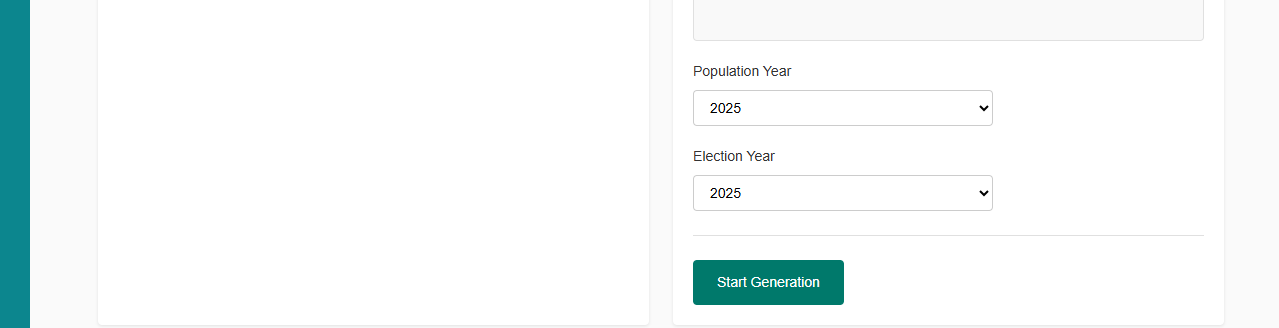
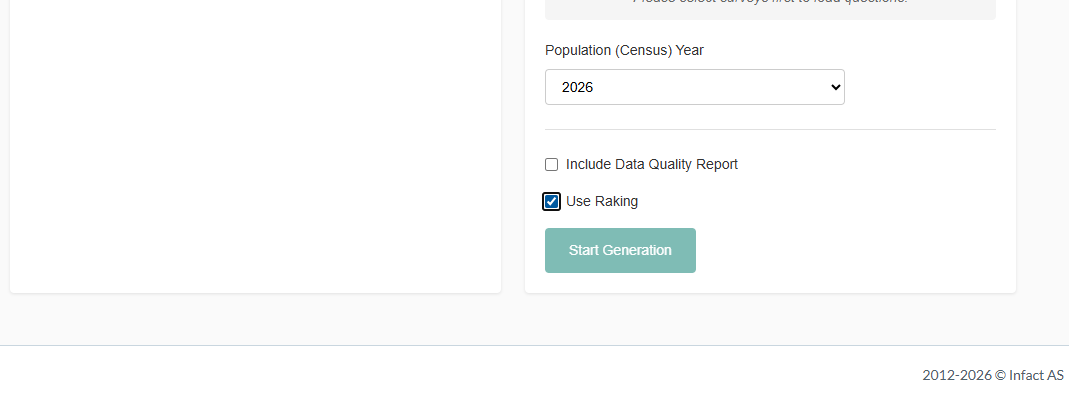
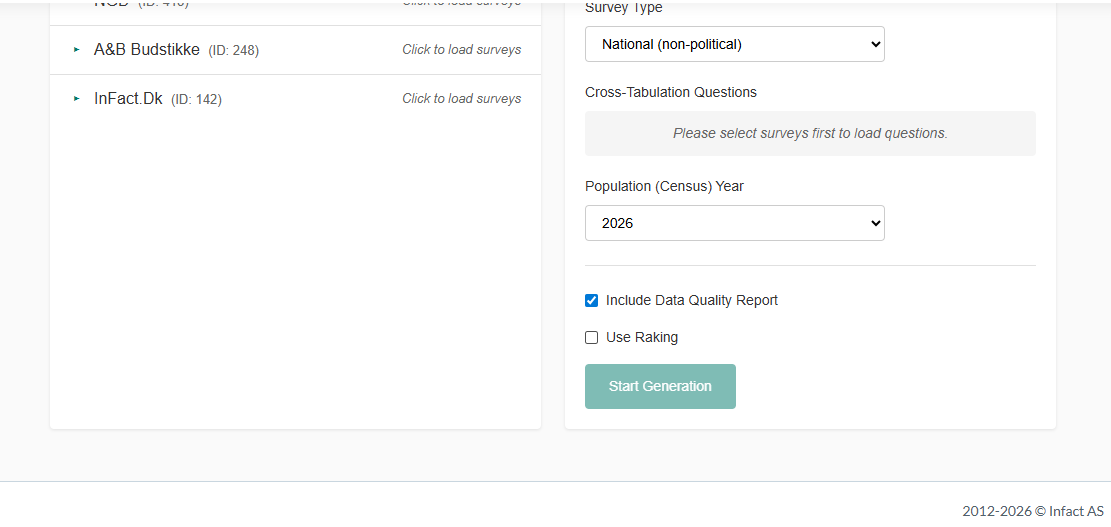
In the end, you need to select the Population (Census) Year:

¶ Flow for political surveys:
Political reports generate two files.
¶ Barometer
This file contains tables created solely based on the political question in the survey. This file is generated automatically. No cross-table selection is required as the system automatically knows which question to use.
The only thing needed is to select a survey for comparison in the left table with the surveys. When the political type is selected, an additional button “Add for Comparison” appears.
The barometer will then include an extra table showing how the previous survey differs from the current one.
¶ Tabellwerk
The second file is essentially what we select in the checkboxes for cross-tabulation. The only nuance is that political and non-political surveys are calculated using different formulas. This is why, if you choose a political survey and generate a political and non-political the same way (same crosstabulation), the data will differ — this is expected.
For municipal and county reports, the corresponding county or municipality must be selected.
¶ Raking
In statistics, raking (more formally, raking ratio estimation) is a method used to adjust survey sample weights so that the sample aligns with known population totals across one or more variables (such as age, gender, or region).
It is commonly referred to as weighting or survey weighting, and is sometimes informally called post-stratification, although raking is a specific iterative form of weighting. The process repeatedly adjusts weights so that the marginal distributions of the sample match the corresponding population margins.
¶ Age Filters
Two new fields have been added to the report generation page — Min Age and Max Age:
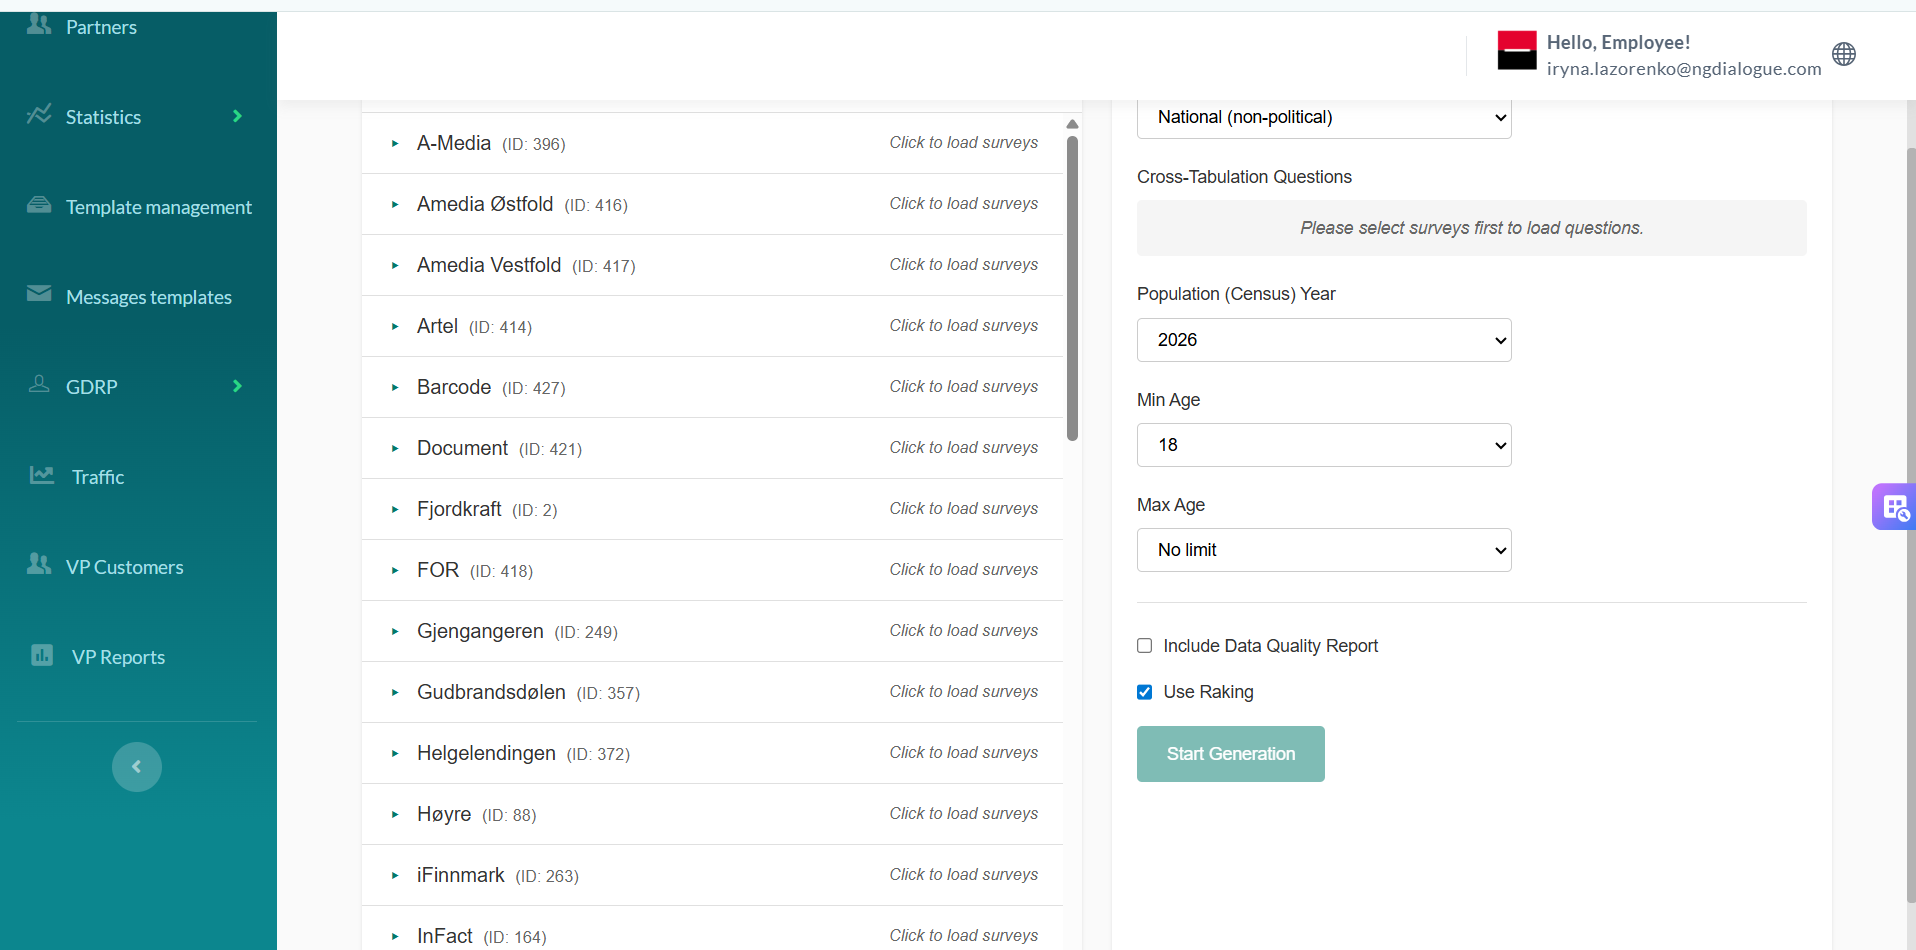
Min Age — minimum respondent age included in the report. Defaults to 18. Can be set from 1 to 120.
Max Age — maximum respondent age. Defaults to "No limit" (same behavior as before).
How this affects the report:
Age groups in the report adapt to the selected values:
| Min Age | Max Age | Groups in report |
|---|---|---|
| 18 (default) | No limit | 18-29, 30-44, 45-64, 65+ (same as before) |
| 16 | No limit | 16-29, 30-44, 45-64, 65+ |
| 30 | 50 | 30-44, 45-50 |
| 1 | No limit | 1-29, 30-44, 45-64, 65+ |
| 18 | 64 | 18-29, 30-44, 45-64 |
If default values are kept — the report will be identical to the previous behavior.
¶ Automated Survey Reports: Response Rates and Discrepancies
¶ Overview
Two new tables are added to each automated survey report to show who responded and how the survey sample compares to known data and population statistics:
Response Rates – call outcomes by demographic groups
Discrepancies – comparison of survey sample, internal database, and population
These tables appear in all supported report types.
¶ Supported Report Types
Six report types are supported:
National – Political / Non-political
County – Political / Non-political
Municipality – Political / Non-political
Each report uses a slightly different structure defined in the template file.
¶ Data Sources and Color Coding
Green/Yellow – CATI system (telephone survey)
Blue – Phone number database
Purple – SSB population data
Color coding helps quickly identify the origin of each figure.
¶ Response Rates Table
Shows survey call outcomes by:
Gender: Mann, Kvinne
Age: 18–29, 30–44, 45–64, 65+
Geography: depends on report type
Education: completed/partial calls only
Party choice: political reports only
¶ Discrepancies Table
Compares the survey sample, phone database, and actual population to highlight over- or under-represented groups.
¶ Key Measures
Standardized Residual – shows how much a result differs from expectation
Cramér’s V – measures the strength of association between categorical variables
¶ Education Weighting and Dynamic Lists
Education weighting adjusts for uneven response patterns
Lists of municipalities and local parties update automatically by report type
¶ Reference
Template file: For_automatation_Response_rates_and_discrepancies.xlsx – defines layouts, formulas, and color coding.